
Why Is Weather So Hard to Predict Beyond 7 Days?
You check the forecast for a trip ten days away and it shows sunshine. Three days before you leave, it shows rain. The forecasters were not careless: beyond about a week, the atmosphere itself stops cooperating. This guide explains why, using the experiment that first revealed the problem, real accuracy figures from NOAA and ECMWF, and a simple model we ran ourselves. It ends with a practical guide to how far ahead you can trust each part of a forecast.
How far ahead forecasts are reliable
NOAA's education site SciJinks gives a plain-language rule of thumb for public forecasts:
- A five-day forecast "can accurately predict the weather approximately 90 percent of the time".
- A seven-day forecast is right "about 80 percent of the time".
- A 10-day or longer forecast "is only right about half the time".
These are rough guides, not a formal score, and accuracy varies a great deal by what is being forecast. Temperature holds up best. Whether it will rain on a given day is harder, and the timing and location of a thunderstorm can be uncertain even a few hours ahead.
| Lead time | Typical reliability | What you can usually trust | Best product to use |
|---|---|---|---|
| 0–2 days | Highest | Temperatures, wind, which half of the day rain arrives; storm timing only roughly | Hourly forecast, radar, official warnings |
| 3–5 days | About 90% (SciJinks, 5-day) | Highs and lows within a few degrees, dry vs unsettled days | Daily forecast |
| 6–7 days | About 80% (SciJinks, 7-day) | Overall pattern: a warm spell, a cold front, a stormy period | Daily forecast plus ensemble probabilities |
| 8–14 days | About 50% (SciJinks, 10-day+) | Tendencies only: warmer or wetter than normal | Ensemble outlooks (e.g. NOAA's 6–10 and 8–14 day outlooks) |
| Weeks 3–6 | Low, but above chance in some patterns | Shifts in odds for the week as a whole | Sub-seasonal (extended-range) forecasts |
| 1–6 months | Odds only | Chance of a warmer, colder, wetter or drier season than average | Seasonal outlooks; climate averages |
The experiment that found the limit
In 1961 Edward Lorenz, a meteorologist at MIT, was running a simple weather model on a Royal McBee computer. Wanting to look again at one run, he restarted it partway through, typing in numbers from a printout. The computer stored six decimal places, such as 0.506127, but the printout showed three, 0.506. The difference was about one part in four thousand, which Lorenz expected to make no difference.
The new run followed the old one for a while, then drifted away, and within a few simulated months the two bore no resemblance. Nothing was broken. The model was deterministic (the same input always gives the same output), yet a tiny change in the starting point produced a completely different future. Lorenz published the result in 1963 as "Deterministic Nonperiodic Flow" in the Journal of the Atmospheric Sciences, using a three-equation system now called the Lorenz-63 model.
The famous name came later. In 1972 Lorenz gave a talk to the American Association for the Advancement of Science titled "Predictability: Does the Flap of a Butterfly's Wings in Brazil Set off a Tornado in Texas?". The butterfly is a metaphor. The precise scientific idea is sensitive dependence on initial conditions: in a chaotic system, small differences at the start grow until they dominate.
Worked example: we re-ran Lorenz's experiment
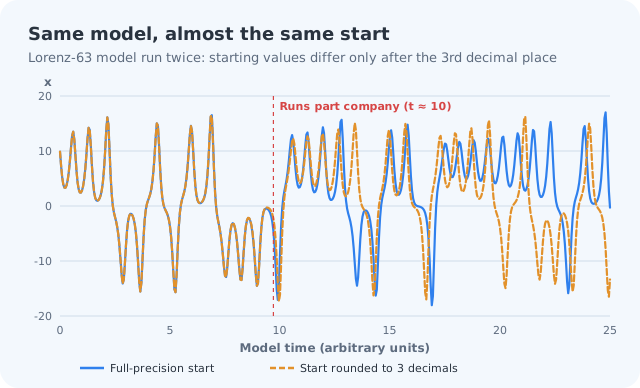
To show the effect with real numbers, we ran the Lorenz-63 equations ourselves (standard settings, 2,500 time steps), twice. The first run starts from full-precision values. The second starts from the same values rounded to three decimals, a change of at most 0.0005 in each variable, just like Lorenz's printout.
- Up to model time 8 the two runs are almost identical; the gap between them is about 0.1 at that point.
- By time 10 the gap has jumped to about 15, as large as the swings of the system itself.
- From then on the two runs are unrelated. Knowing one tells you nothing about the other.
Why errors grow, and why they stop growing
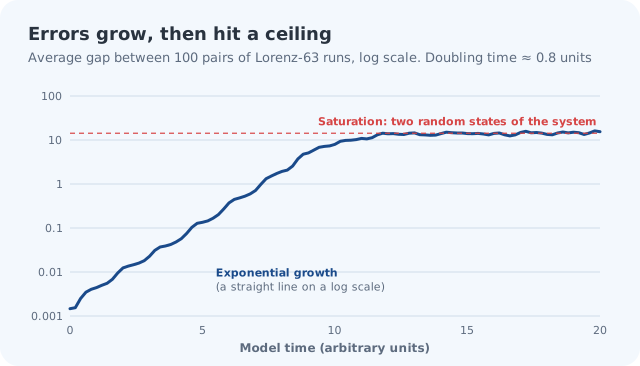
The twin-run experiment is one case. Repeating it from 100 different starting points with small random errors shows the general pattern. Errors grow exponentially: in our runs they doubled roughly every 0.8 model time units, so on a logarithmic scale the line is close to straight. After a while the growth stops, because the two runs are as far apart as two random states of the system can be. At that point the forecast has no more skill than picking a typical day at random.
The real atmosphere behaves the same way, with one complication. Errors grow fastest at the smallest scales. The exact position of a thunderstorm cell can be lost within hours, while a large weather system such as a mid-latitude low stays predictable for days. Those small-scale errors then spread upward and eventually corrupt the large-scale pattern too. That is why a forecast can be right about "a cold front on Thursday" a week out, but wrong about whether your town gets a downpour at 4 pm.
Is two weeks a hard limit?
Often you will read that forecasting beyond two weeks is impossible "even with perfect observations". Strictly, that is wrong: with literally perfect starting data and a perfect model, a deterministic system could be forecast indefinitely. The limit appears because real observations always contain some error, however small, and those errors grow.
A 2019 study led by Fuqing Zhang at Penn State, published in the Journal of the Atmospheric Sciences, asked how far ahead day-to-day weather could be forecast if initial errors were made far smaller than they are today. The answer was "about two weeks" on average for mid-latitude weather. The authors put current reliable skill at about nine to 10 days, so better data, models and computers could add perhaps four to five more days, but not much beyond that.
How forecasts have improved
Within that ceiling, progress has been steady. A 2015 review in Nature by Peter Bauer, Alan Thorpe and Gilbert Brunet, "The quiet revolution of numerical weather prediction", found that forecast skill has increased by about one day per decade over the past 40 years. In practice that means a forecast today for five days ahead is roughly as good as a forecast for two days ahead was 30 years ago (5 minus 3 decades × 1 day). Another common way to put it: today's one-week forecasts are about as good as a typical three-day forecast was in 1980.
Much of the gain came from satellites, better ways of feeding observations into models, finer model grids and faster computers. Our explainer on how weather forecasting works covers that process step by step.
Ensembles: forecasting the uncertainty itself
Since a single forecast cannot escape chaos, forecast centres run the model many times from slightly different starting points, an ensemble. If the runs agree, confidence is high; if they spread out, the forecast is uncertain, and the spread tells you how uncertain.
- ECMWF (the European Centre for Medium-Range Weather Forecasts) runs its ensemble, ENS, with 51 members (one control run plus 50 perturbed runs) at about 9 km resolution, out to 15 days, from 00 and 12 UTC each day. Its extended-range version has run daily with 101 members out to 46 days since the June 2023 upgrade.
- NOAA's GEFS has 31 members (30 perturbed plus a control) since its 2020 upgrade, running to 16 days, and once a day to 35 days.
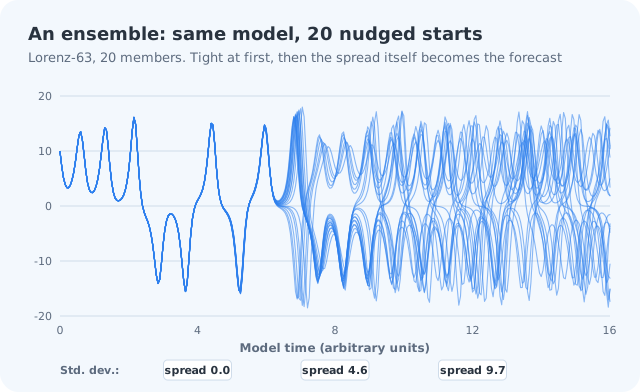
Ensembles also produce the percentages you see. If 31 of ECMWF's 51 members show rain at a place on a given day, that is a 61% chance of rain from the ensemble (31 ÷ 51). Forecasters then adjust raw model output with their own judgement and statistical corrections. Our guide on how to read a weather forecast explains what a "40% chance of rain" does and does not mean.
Beyond two weeks: sub-seasonal and seasonal outlooks
Past the two-week limit, forecasts stop predicting specific days and instead shift the odds for a week, a month or a season. They draw on slow-changing parts of the climate system that nudge the weather in one direction:
- El Niño and La Niña: sea-surface temperatures in the tropical Pacific, which affect rainfall and temperature patterns worldwide for months.
- The Madden–Julian Oscillation (MJO): an eastward-moving pulse of tropical cloud and rain, from the Indian Ocean towards the Pacific, that influences weather far away in the following weeks.
- The North Atlantic and Arctic Oscillations: pressure patterns that steer storm tracks over Europe and North America.
- The stratospheric polar vortex: when this ring of winds 15–50 km above the Arctic weakens, for example after a sudden stratospheric warming, the odds of cold spells in northern Europe rise, although models over-forecast this link.
A seasonal outlook reads like a probability, for example (hypothetically) "a 60% chance that winter will be warmer than the 1991–2020 average". It says nothing about whether a particular week will be cold. For planning months ahead, climate averages are often more useful: our city guides give the typical monthly highs, lows and rainfall for 30 cities, from 1991–2020 normals.
What this means for hoyoopin
hoyoopin's Weather page shows the current conditions and a three-day forecast (highs and lows) for any city, not a 7- or 10-day forecast. That matches the window where forecasts are most reliable. For days 4 to 10, use your national weather service's forecast and read it as a trend. For a trip further ahead, start with the city guide for your destination and check the live forecast as the date approaches.
For severe weather such as hurricanes, floods, heatwaves or blizzards, always follow the warnings from your national weather service rather than any app's point forecast. Warnings are issued by forecasters who weigh all the models and local knowledge.
The short version
- NOAA's rule of thumb: 5-day forecasts are right about 90% of the time, 7-day about 80%, 10-day about half the time.
- Lorenz showed in 1961–63 that tiny starting differences grow until they swamp a forecast. The "butterfly effect" is the 1972 metaphor for it.
- Errors grow fastest at small scales: storm timing goes first, large patterns last longest.
- The practical limit for daily weather is about two weeks; current skill reaches about 9–10 days.
- Skill has improved by about one day per decade.
- Use ensembles and probabilities for days 6–14, and climate averages beyond that.
Frequently asked questions
How accurate is a 7-day weather forecast?
NOAA's education site SciJinks says a seven-day forecast is right about 80% of the time, a five-day forecast about 90%, and a 10-day or longer forecast only about half the time. Temperature is usually more reliable than rain timing.
Why can't supercomputers forecast weather a month ahead?
The atmosphere is chaotic: small errors in the starting data grow exponentially until they swamp the forecast. Research led by Penn State in 2019 put the practical limit for day-to-day weather at about two weeks, even with much better observations.
What is the butterfly effect?
It is the popular name for sensitive dependence on initial conditions, discovered by Edward Lorenz in 1961 and published in 1963. The name comes from his 1972 talk 'Does the Flap of a Butterfly's Wings in Brazil Set off a Tornado in Texas?'. The butterfly is a metaphor.
What is an ensemble forecast?
A set of model runs started from slightly different conditions. ECMWF's ensemble has 51 members; NOAA's GEFS has 31. Agreement means confidence; spread shows uncertainty and gives the percentages in probability forecasts.
Sources
- Forecast reliability: how reliable are weather forecasts? — NOAA SciJinks
- Edward Lorenz biography — MacTutor, University of St Andrews
- January 1961: Lorenz and the butterfly effect — APS News
- Predictability limit: scientists find bounds of weather forecasting — Penn State
- Review: The quiet revolution of numerical weather prediction — World Meteorological Organization
- Extended-range forecasts to be recast in next model upgrade — ECMWF