
What Is the Air Quality Index (AQI)? What 50, 100 and 150 Really Mean
Weather apps now show an air quality number next to the temperature, but the number depends on which country's scale the app uses. The same smoky afternoon can be "Moderate" in one system and "Very High" in another. This guide explains how the US Air Quality Index (AQI) works after the 2024 update, what a reading of 75 or 100 actually means, how other countries score the same air, and what you can sensibly do on a bad day.
How the US AQI is built
The US Environmental Protection Agency (EPA) AQI covers five pollutants: ground-level ozone, particle pollution (PM2.5 and PM10), carbon monoxide, sulphur dioxide and nitrogen dioxide. Each pollutant's concentration is converted to its own sub-index on a 0–500 scale, and the highest sub-index becomes the AQI you see. That pollutant is called the dominant pollutant. On a hot, sunny summer afternoon it is often ozone; during wildfire smoke or winter inversions it is usually PM2.5.
The conversion is a straight line between published breakpoints:
AQI = (I_high − I_low) / (C_high − C_low) × (C − C_low) + I_low
where C is the measured concentration and the other four values are the edges of the band it falls in.
The six categories and the 2024 PM2.5 update
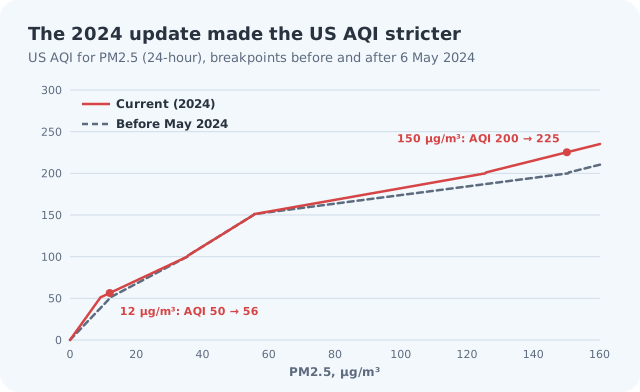
In February 2024 the EPA lowered the annual PM2.5 standard to 9.0 µg/m³ and revised the AQI to match, with effect from 6 May 2024. The top of the Good band dropped from 12.0 to 9.0 µg/m³, the Unhealthy and Very Unhealthy bands were tightened, and the two old Hazardous bands were merged into one: Hazardous is now simply 301 and higher.
| Category (colour) | AQI | PM2.5, 24-hour (µg/m³) | What AirNow says |
|---|---|---|---|
| Good (green) | 0–50 | 0.0–9.0 | Air pollution poses little or no risk |
| Moderate (yellow) | 51–100 | 9.1–35.4 | Acceptable; some risk for people unusually sensitive to air pollution |
| Unhealthy for Sensitive Groups (orange) | 101–150 | 35.5–55.4 | Sensitive groups may experience health effects; the general public is less likely to be affected |
| Unhealthy (red) | 151–200 | 55.5–125.4 | Some members of the general public may experience health effects; sensitive groups more serious effects |
| Very Unhealthy (purple) | 201–300 | 125.5–225.4 | Health alert: risk increased for everyone |
| Hazardous (maroon) | 301+ | 225.5+ | Health warning of emergency conditions: everyone more likely to be affected |
Worked example: what do 75 and 100 mean?
Take a day where PM2.5 is the dominant pollutant.
- AQI 75 sits in the Moderate band (51–100, 9.1–35.4 µg/m³). Solving the formula backwards: 9.1 + (75 − 51) × (35.4 − 9.1) / (100 − 51) = about 22 µg/m³. Most people will not notice it, but it is already about 1.5 times the WHO 24-hour guideline of 15 µg/m³.
- AQI 100 is the top of Moderate, which is 35.4 µg/m³ of PM2.5. One more step and you are in the orange band, where sensitive groups should cut back on long or heavy outdoor exertion.
- 40 µg/m³ going the other way: (150 − 101) / (55.4 − 35.5) × (40 − 35.5) + 101 = 112, Unhealthy for Sensitive Groups.
So "Should you worry at 100?" Most healthy adults need not change plans at 100, but if you are in a sensitive group (asthma, heart or lung disease, pregnancy, older age, children and teenagers, or anyone working or exercising hard outdoors), 100 is the point to start paying attention to the forecast.
Particles and gases: a quick guide
- PM2.5: particles 2.5 micrometres or smaller, from combustion, traffic, industry, wildfire smoke and chemical reactions in the air. Small enough to reach deep into the lungs.
- PM10: all particles 10 micrometres or smaller, so it includes PM2.5. The 2.5–10 µm part, from dust, construction and road wear, is called coarse particulate matter.
- Ozone (O₃): not emitted directly. It forms when nitrogen oxides and volatile organic compounds (from traffic, industry, solvents and even vegetation) react in sunlight, so it peaks on hot, bright afternoons.
- Nitrogen dioxide, sulphur dioxide, carbon monoxide: gases mainly from fuel combustion, power generation and industry.
Other countries, other numbers
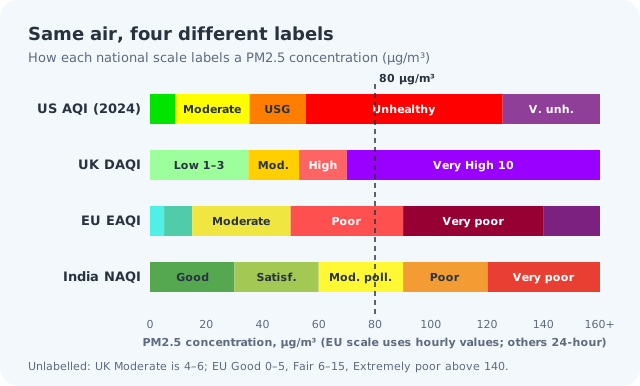
The idea of colour-coded bands is shared worldwide, but the scales and cut-offs are not, so you cannot compare a "100" in Delhi with a "100" in Denver.
- European Air Quality Index (EEA): six bands with no number (Good, Fair, Moderate, Poor, Very poor, Extremely poor). Revised to reflect the WHO 2021 guidelines; it now uses hourly concentrations, with PM2.5 Good at 0–5 µg/m³.
- UK Daily Air Quality Index (DAQI): a 1–10 scale in four bands, Low (1–3), Moderate (4–6), High (7–9) and Very High (10). For PM2.5, index 10 starts at a 24-hour mean of 71 µg/m³.
- India National AQI: 0–500 like the US, launched in 2014, with bands named Good, Satisfactory, Moderately polluted, Poor, Very poor and Severe, and much looser PM2.5 cut-offs (Good up to 30 µg/m³).
- China AQI: also 0–500 in six levels, from Excellent to Severe pollution. Under the 2012 rules an index of 100 meant 75 µg/m³ of PM2.5. China's environment ministry issued a revised AQI specification (HJ 633-2026) in February 2026 that updates the PM2.5 and PM10 limits.
| PM2.5 (µg/m³) | US AQI (2024) | UK DAQI | EU EAQI* | India NAQI | vs WHO 24-h guideline (15) |
|---|---|---|---|---|---|
| 5 | 28 Good | 1 Low | Good | Good | 0.3× |
| 15 | 62 Moderate | 2 Low | Fair | Good | 1.0× |
| 25 | 81 Moderate | 3 Low | Moderate | Good | 1.7× |
| 40 | 112 Sensitive groups | 4 Moderate | Moderate | Satisfactory | 2.7× |
| 80 | 168 Unhealthy | 10 Very High | Poor | Moderately polluted | 5.3× |
| 150 | 225 Very Unhealthy | 10 Very High | Extremely poor | Very poor | 10× |
*The EEA index uses hourly values while the others use 24-hour means, so treat that column as indicative. US AQI values are computed with the EPA formula above.
WHO guideline values
The World Health Organization does not run an index. It publishes guideline levels, last revised in 2021 and much stricter than most national standards:
| Pollutant | Annual mean | Short-term |
|---|---|---|
| PM2.5 | 5 µg/m³ | 15 µg/m³ (24-hour) |
| PM10 | 15 µg/m³ | 45 µg/m³ (24-hour) |
| Nitrogen dioxide | 10 µg/m³ | 25 µg/m³ (24-hour) |
| Ozone | 60 µg/m³ (peak season) | 100 µg/m³ (8-hour) |
| Sulphur dioxide | – | 40 µg/m³ (24-hour) |
| Carbon monoxide | – | 4 mg/m³ (24-hour) |
Where the air is worst, and where it improved
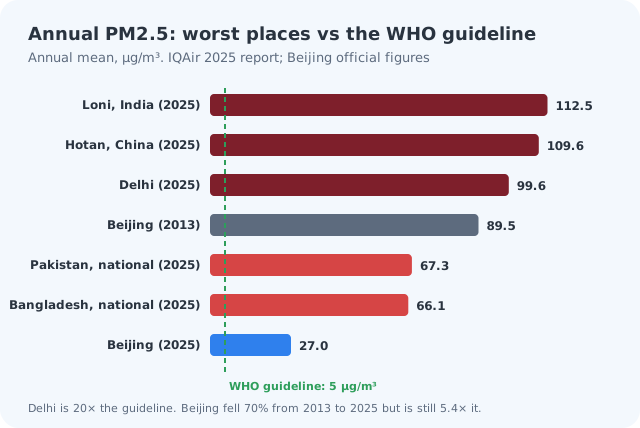
IQAir's 2025 World Air Quality Report, published in March 2026, covered 9,446 cities in 143 countries and territories. Only 14% of cities met the WHO PM2.5 guideline, down from 17% in 2024. The most polluted city was Loni in India (112.5 µg/m³), followed by Hotan in China (109.6). Delhi was the most polluted capital at 99.6 µg/m³, about 20 times the guideline, and Pakistan (67.3) and Bangladesh (66.1) were the most polluted countries. Thirteen countries and territories met the guideline, including Australia, Iceland, Estonia and Panama.
Beijing, long a byword for smog, is now an improvement story. Its official annual PM2.5 average fell from 89.5 µg/m³ in 2013 to 27.0 µg/m³ in 2025, a drop of about 70%, although that is still more than five times the WHO guideline.
What to do on a bad air day
- Check the forecast and the dominant pollutant. AirNow and most national services publish next-day forecasts. Plan hard exercise for when levels are lower; ozone is usually lowest in the morning.
- Cut exertion, not just time outdoors. The heavier you breathe, the more you inhale.
- Clean the air indoors. Keep windows shut during smoke events and run a HEPA air purifier in the room you use most.
- Use a respirator only for particles. A well-fitted N95 or FFP2 respirator filters fine particles such as smoke. CDC/NIOSH stresses that these respirators do not protect against gases or vapours, so they do nothing for ozone or nitrogen dioxide. They need a tight seal (facial hair causes leaks) and they are not designed to fit children. If you have heart or lung disease, ask your doctor before wearing one, because a respirator makes breathing harder; take it off and move to cleaner air if you feel short of breath or dizzy. Cloth masks, surgical masks and paper dust masks give little or no protection from smoke particles.
Air quality on hoyoopin
hoyoopin does not show air quality at the moment: the Weather page and the weather boxes on city and country pages cover temperature, feels like, humidity, wind, the chance of rain and a three-day forecast. For air quality, use your national service, which publishes the readings, the dominant pollutant and next-day forecasts: AirNow in the US, UK-AIR in the UK, the European Environment Agency's index in Europe, or the equivalent where you are. If heat and air pollution arrive together, our extreme heat guide covers the heat side.
The short version
- The US AQI reports the worst of five pollutant sub-indices on a 0–500 scale.
- Since May 2024, Good PM2.5 ends at 9.0 µg/m³ and Hazardous is 301 and above.
- AQI 100 equals 35.4 µg/m³ of PM2.5; AQI 75 is about 22 µg/m³.
- The UK, EU, India and China use different scales, so compare concentrations, not index numbers.
- N95/FFP2 respirators help with smoke and particles, not ozone or other gases.
Frequently asked questions
What does an AQI of 100 mean?
On the US scale, 100 is the top of the Moderate (yellow) band. When PM2.5 is the dominant pollutant it equals 35.4 µg/m³ over 24 hours. Most people are fine, but sensitive groups (people with asthma, heart or lung disease, pregnant people, older adults, children and teens, and people active outdoors) should start watching the forecast.
What changed in the AQI in 2024?
The US EPA lowered the annual PM2.5 standard to 9.0 µg/m³ and revised the AQI from 6 May 2024. Good now ends at 9.0 µg/m³ instead of 12.0, the Unhealthy and Very Unhealthy bands were tightened, and Hazardous is now any value of 301 or more.
Is an AQI in India or the UK the same as in the US?
No. India's National AQI also runs 0 to 500 but with looser PM2.5 cut-offs, the UK uses a 1 to 10 Daily Air Quality Index, and the European index has six named bands with no number. Compare pollutant concentrations, not index values.
Does an N95 mask protect against air pollution?
A well-fitted N95 or FFP2 respirator filters fine particles such as wildfire smoke. It does not protect against gases like ozone or nitrogen dioxide, so it does not help on ozone days. Cloth, surgical and paper dust masks give little or no protection from smoke. If you have heart or lung disease, ask your doctor before using a respirator.
Sources
- Final updates to the AQI for particle pollution (fact sheet) — US EPA
- Air Quality Index (AQI) basics — AirNow
- WHO global air quality guidelines (2021) — World Health Organization
- European Air Quality Index — European Environment Agency
- Pollutant concentrations for the Daily Air Quality Index — UK Government
- Pakistan world's most polluted country in 2025: report — Al Jazeera
- Technical specifications on ambient air quality index (HJ 633—2026) — Ministry of Ecology and Environment of China
- Beijing's PM2.5 falls below 30 micrograms for the first time — Chinese Academy of Engineering (Beijing Municipal Ecology and Environment Bureau figures, 2013 and 2025)